
Fast cars, fast money, fast….websites?
More and more users are browsing the web from their mobile devices rather than their desktops.
Mobile users generally won’t have access to high-speed broadband when they’re on the move meaning it will be more difficult for them to load websites which have been poorly optimised for page speed, so it has become increasingly important for websites to deliver their content to cater to these users.
Unfortunately, it’s going to take a bit more work than just jamming lots of speed holes into your website.

There are tools to assist in identifying ways to improve a website’s load speed which provide a checklist of optimisations you can perform on your website which should decrease page load speeds.
There are plenty of tools on the web that will do this, but here we’re looking at Google PageSpeed Insights.
What Is Google Page Insights?
Google PageSpeed Insights is a tool that analyzes a website’s load speed optimization and provides suggestions on how to make improvements to your website and make it load quicker.
These suggestions include reducing image sizes, compressing and minifying files, enabling browser caching and improving your server.
There are lots of other page insight tools available, such as GTMetrix and Pingdom Tools, but since page load times directly affect a website’s rankings in Google’s search results, we’ll be using Google PageSpeed Insights.
Why it is Important to Aim for a High Page Speed
Before we get into the why, let’s get into the what. Page Insights measures your Speed Score and Optimisation Score.
Speed Score uses two real-world metrics to compare your site speed against other sites across the web, First Contentful Paint (How fast the first piece on content loads) and DOMContentLoaded(How fast for all content to load):
- Fast: The site’s average metric value is in the top third of all page loads.
- Average: The site’s average metric value is in the middle third of all page loads.
- Slow: The site’s average metric value is in the bottom third of all page loads.
Optimization Score determines how well a website follows common performance best practices and evaluates the site giving it a score between 0 and 100:
- Good: The page score is 80 or over. Awesome! Your website follows many best performance practices and there’s little room for improvement.
- Medium: The page score is between 60 and 79. Your website follows some of the best performance practices and there is a moderate amount of room for improvement.
- Low: The page speed is between 0 and 59. Your website does not follow best performance practices and there is a lot of room for improvement (Ie. it NEEDS improvement).
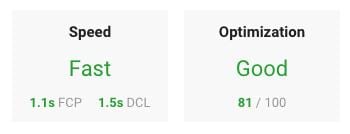
Looking good! (and fast!)
Keynote: Some sites will have the “Speed” section unavailable. This is because Google doesn’t have enough data to measure your site’s page speed yet. So if your site has light traffic, you will not be able to view this statistic until an undisclosed amount of data is available. Not particularly helpful for smaller sites, unfortunately.
“My website’s optimisation score isn’t up to 100, it needs to be 100!” Em… no, it doesn’t.
Page Speed Insights is simply a checklist for your site to help you achieve better page speeds, it should not be biblically followed. It is possible to get your site to 100 but in the vast majority of cases, checking off those final optimizations usually involves sacrificing site functionality.
Don’t stress about not achieving 100/100. If your site is above 80 then you have nothing to be worrying about. Even so, depending on the size of your website and it’s functionality, achieving a score of 80 might be a far-off pipe dream.
If you have performed as many optimisations as you can on your site and you still haven’t gotten a score of 80 then there’s no need to lose sleep at night over your score, you’ve done all that you can.
Search Engine Optimisation
First and foremost, your website’s Page Speed directly affects your users. Your users will have a poor experience with your website and this will affect your dwell time – which will impact on your positioning in search results. A higher score will potentially raise your position while a poor score will lower it.
From July 2018, mobile page speed will officially be a ranking factor. Google said so. It’s already been a factor for quite some time, but it will be official.
For example, let’s say that you and your competitor have identical websites. Your website has a respectable score of 70 but your competitor has put in the extra effort for optimisation and has a score of 85. In this case, it’s likely that your competitor is going to rank higher in the search results than you.
Of course, you and your competitor won’t have identical sites (hopefully!) and there are many other factors affecting SEO such as content, technical SEO and strong/relevant links, but improving your Page Speed is something you can work on improving yourself without having to rely on outside influences.
User Experience
User Experience is how easy and usable your site is to those who visit it. According to a Google Adsense blog on page speed statistics, 50% of users expect a website to load within 2 seconds and 53% of mobile users are likely to leave your site if it doesn’t load within 3 seconds. As Page Speed directly correlates with how fast your website loads and studies show that most users are very impatient, then it is expected that a low Page Speed will deliver a poor user experience to visitors on your site.
Understanding the Lingo
Page Stats
This section details some general statistics on the page speed of your site; the round trips needed to load the page render-blocking resources (The resources that stop the pages HTML from loading), how many bytes were needed to load the page, and how it compares to the median of all other sites statistics.
Optimisation Suggestions
Google Page Insights has a plethora of optimisation suggestions. If your site is built reasonably well then you probably haven’t even heard of some of them!
Avoid Landing Page Redirects
Every time the page gets redirected, page loading stops and has to start again on a new page.
That’s bad.
As a result, redirects have the potential to add many more seconds to your page load speed. This isn’t so common nowadays as the bog standard for optimisations have increased in recent years but it is an issue that would plague a lot of older sites.
Optimise Images
Large image sizes can demolish a page’s load speed. Unoptimised, poorly sized image can add megabytes of data to a page. Generally, if an image’s size is over 1MB then there are optimisations that need to be done. According to the Screen Resolution Stats Worldwide (At the time of writing this), only 8% of users are viewing the web on a browser size of 1920 x 1080. If your images are any larger than that, then you should strongly consider cropping or resize the image.
Image files contain lots of unnecessary data that is not needed to display images on the web. You can use an image optimisation tool, such as Optimizilla, to automatically remove the data which can drastically reduce the file size of your image without the loss of quality.
Eliminate render-blocking JavaScript and CSS in above-the-fold content
This optimisation is one you will most commonly see. Depending on your site’s functionality requirements, you won’t be able to fix this. JavaScript is all about delivering functionality to your website.
Render-blocking JavaScript is JavaScript that prevents the page from being loaded before it has finished loaded itself. In many cases, JavaScript needs to be loaded before the page loads to function and sometimes there just isn’t a way around that.
In the same vein as JavaScript, “CSS in above-the-fold content” is warning that the page won’t finish loading until the CSS files mentioned have been loaded.
Minifying HTML, CSS and JavaScript
Google PageSpeed Insights suggests minifying files when it detects that the size of HTML, CSS or JavaScript files can be reduced. During site development, web developers have one major fault: They need files in a readable format to understand what’s going on.
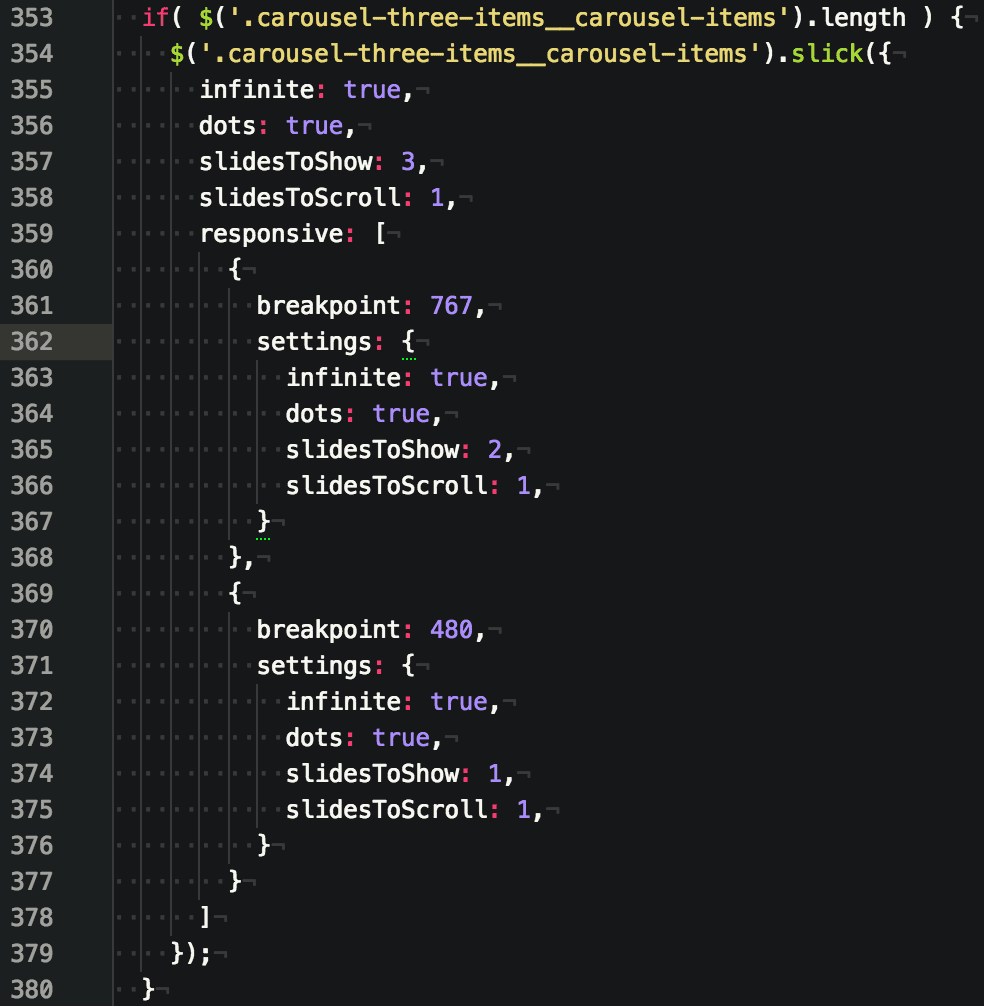
Even if you aren’t a developer, you can probably hazard a guess as to what this does.
The image above shows un-minified content. It’s easy to read but as you can see on the left of the screenshot, we’re 380 lines deep into the file, with hundreds of more lines to go before we reach the end of the file. This makes the file size quite large in comparison to it’s minified counterpart.
Now let’s see what happens when the file is minified:
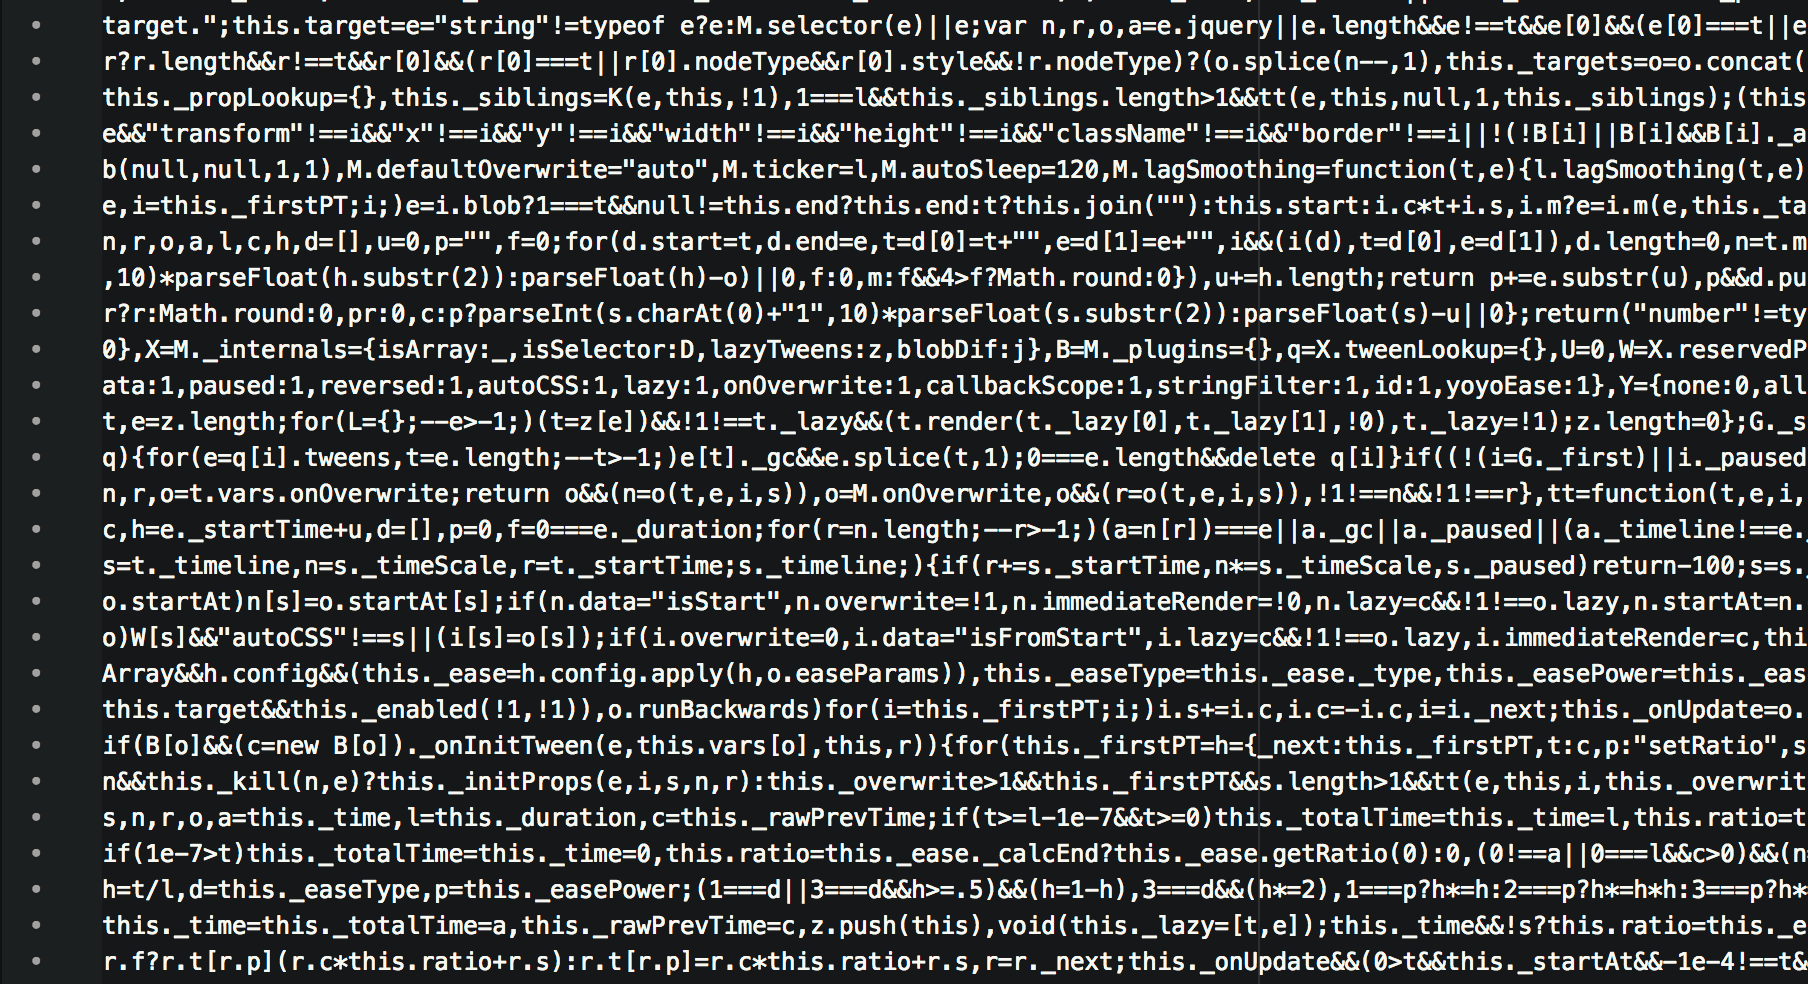
This is the same file but instead of things like single brackets taking up entire lines, the entirety of the file’s contents are smushed up together into an incomprehensible mess (for humans anyway). Since the computer doesn’t need to have things all nice and tidy like us humans, it has no problem reading the minified file.
Leverage Browser Caching
Caching allows the web browser to remember elements of a web page from previous visits.
For example; let’s say you visit www.friday.ie on Monday for the first time. The site loads pretty quickly but there’s obvious load in for images and the logo. A few days later, we think to ourselves
“Wow, that Friday site was super cool! I want to visit it again!”.
Since the site has browser caching enabled, those images that had obvious load issues now load very quickly, almost instantaneously, why? Your browser has remembered those images from your previous visit so it doesn’t need to request the images from the site’s server, it just loads it directly from your browser’s cache memory.
There is also server cache, which works the same as browser caching but the site elements are remembered by the server the site is hosted on.
Reduce Server Response Time
The server response time is how quickly your server can begin loading in the HTML of your site to the user accessing it. Any time your website needs to connect to the server to retrieve or send data is time added on to the server response time.
Google lists off some potential factors; Slow application logic, slow database queries, slow routing, frameworks, libraries, resource CPU starvation or memory starvation. Basically, Google is saying if your site is built poorly, is too bloated with data or is on a cheap server, then your server response time is going to suffer.
Conclusion
Google PageSpeed Insights is a useful tool for obtaining information about the speed of your website and offers optimisation suggestions to help improve that speed and helps your site fall in line with optimisation best practices. If the optimisations Page Insights suggests are easily achievable, then you should definitely try to apply them to your site.
However, achieving a perfect 100/100 score shouldn’t take priority over your site’s design or functionality. In many cases, getting a score of 100 just is not possible depending on how your site is set up and you should not worry about not being able to reach that score. All you can do is make sure you have performed any realistic optimisations on your site that Page Insights have suggested and don’t stress about it.
Hopefully, this article has shed some light on what Google PageSpeed Insights does and what it’s suggested optimisations mean.
Why not check out some of my other articles here?


