
If you’ve ever spent time trying to make sense of user data, you probably know the feeling of having numbers everywhere, patterns popping up, and graphs pointing to something important.
It’s tempting to think that’s all you need to understand your users. After all, if the data says so, it must be true, right?
But over time, something becomes clear: numbers alone aren’t enough. Behind every click, scroll, or bounce, there’s a person making decisions based on their reasons, frustrations, and desires. To really understand users beyond just tracking what they’re doing, you need to know why they’re doing it.
That’s where user research comes in. It gives us the story behind the numbers – the real human insights that data can only hint at.
While analytics can reveal what users are doing, user research uncovers why they are doing it. For me, the magic happens when these two disciplines come together. Here’s how I see them complementing each other.
Noticing Patterns in User Behaviour
Quantitative analytics helps us spot patterns and identify trends clearly and objectively. It’s about recognising what users are doing across your product or website, tracking and measuring user interactions like click rates, drop-offs, conversions, and time spent on a page. Tools like Google Analytics, Microsoft Clarity and Hotjar are excellent for tracking these interactions and can quickly highlight areas of friction or success in your product.
When you dive into analytics, it gives us the “what” or answers the “how many?”, for example:
- How many users abandoned their carts and at what stage?
- Which parts of your website or app are users spending the most time on?
- Which features get the most engagement?
- At what step did most users leave the signup flow?
The value of analytics lies in its ability to highlight patterns quickly and at scale. You get a clear view of user actions – where they’re spending time, what they’re clicking, and even what they’re ignoring. This clarity helps you pinpoint areas for improvement or investment.
However, there’s a catch.
While analytics reveals what users do, it often leaves out critical context. For example, if your data shows a significant number of users leaving at checkout, analytics alone don’t explain why they didn’t complete their purchase. Is it pricing, confusion, or a technical problem? You won’t find those answers purely in the numbers.
Discovering Why Users Do What They Do
This is where user research comes into play. User research techniques like interviews, usability testing, diary studies or even simple surveys offer depth and context. Unlike analytics, qualitative insights are nuanced and human. They reveal the thought processes, motivations and emotions behind user actions.
For example, if analytics show users leaving your site at checkout, user interviews might reveal they’re unsure about delivery times or they don’t trust the payment gateway. Without research, you could misinterpret the data and apply ineffective solutions.
Research gives you insights into:
- The real motivations behind users’ actions.
- Their frustrations and what they’re struggling with.
- The emotional responses they have to your interface, messaging, or overall experience.
Imagine you have data showing users frequently abandoning their carts. Through user interviews, you might discover they felt uncertain about delivery costs or had concerns about payment security. Without these insights, you could waste resources trying to fix the wrong problems based on numbers and guesswork.
Qualitative research paints a rich, detailed picture of your users’ thought processes and emotions. These insights aren’t just informative; they’re actionable. They help a team empathise deeply with the users, guiding better product decisions and creating experiences that genuinely resonate.
Power of Combination
When you integrate analytics with user research, you unlock the combined power of both. Analytics identifies the problems or opportunities, while research explains the reasons behind them and suggests solutions. Consider this scenario:
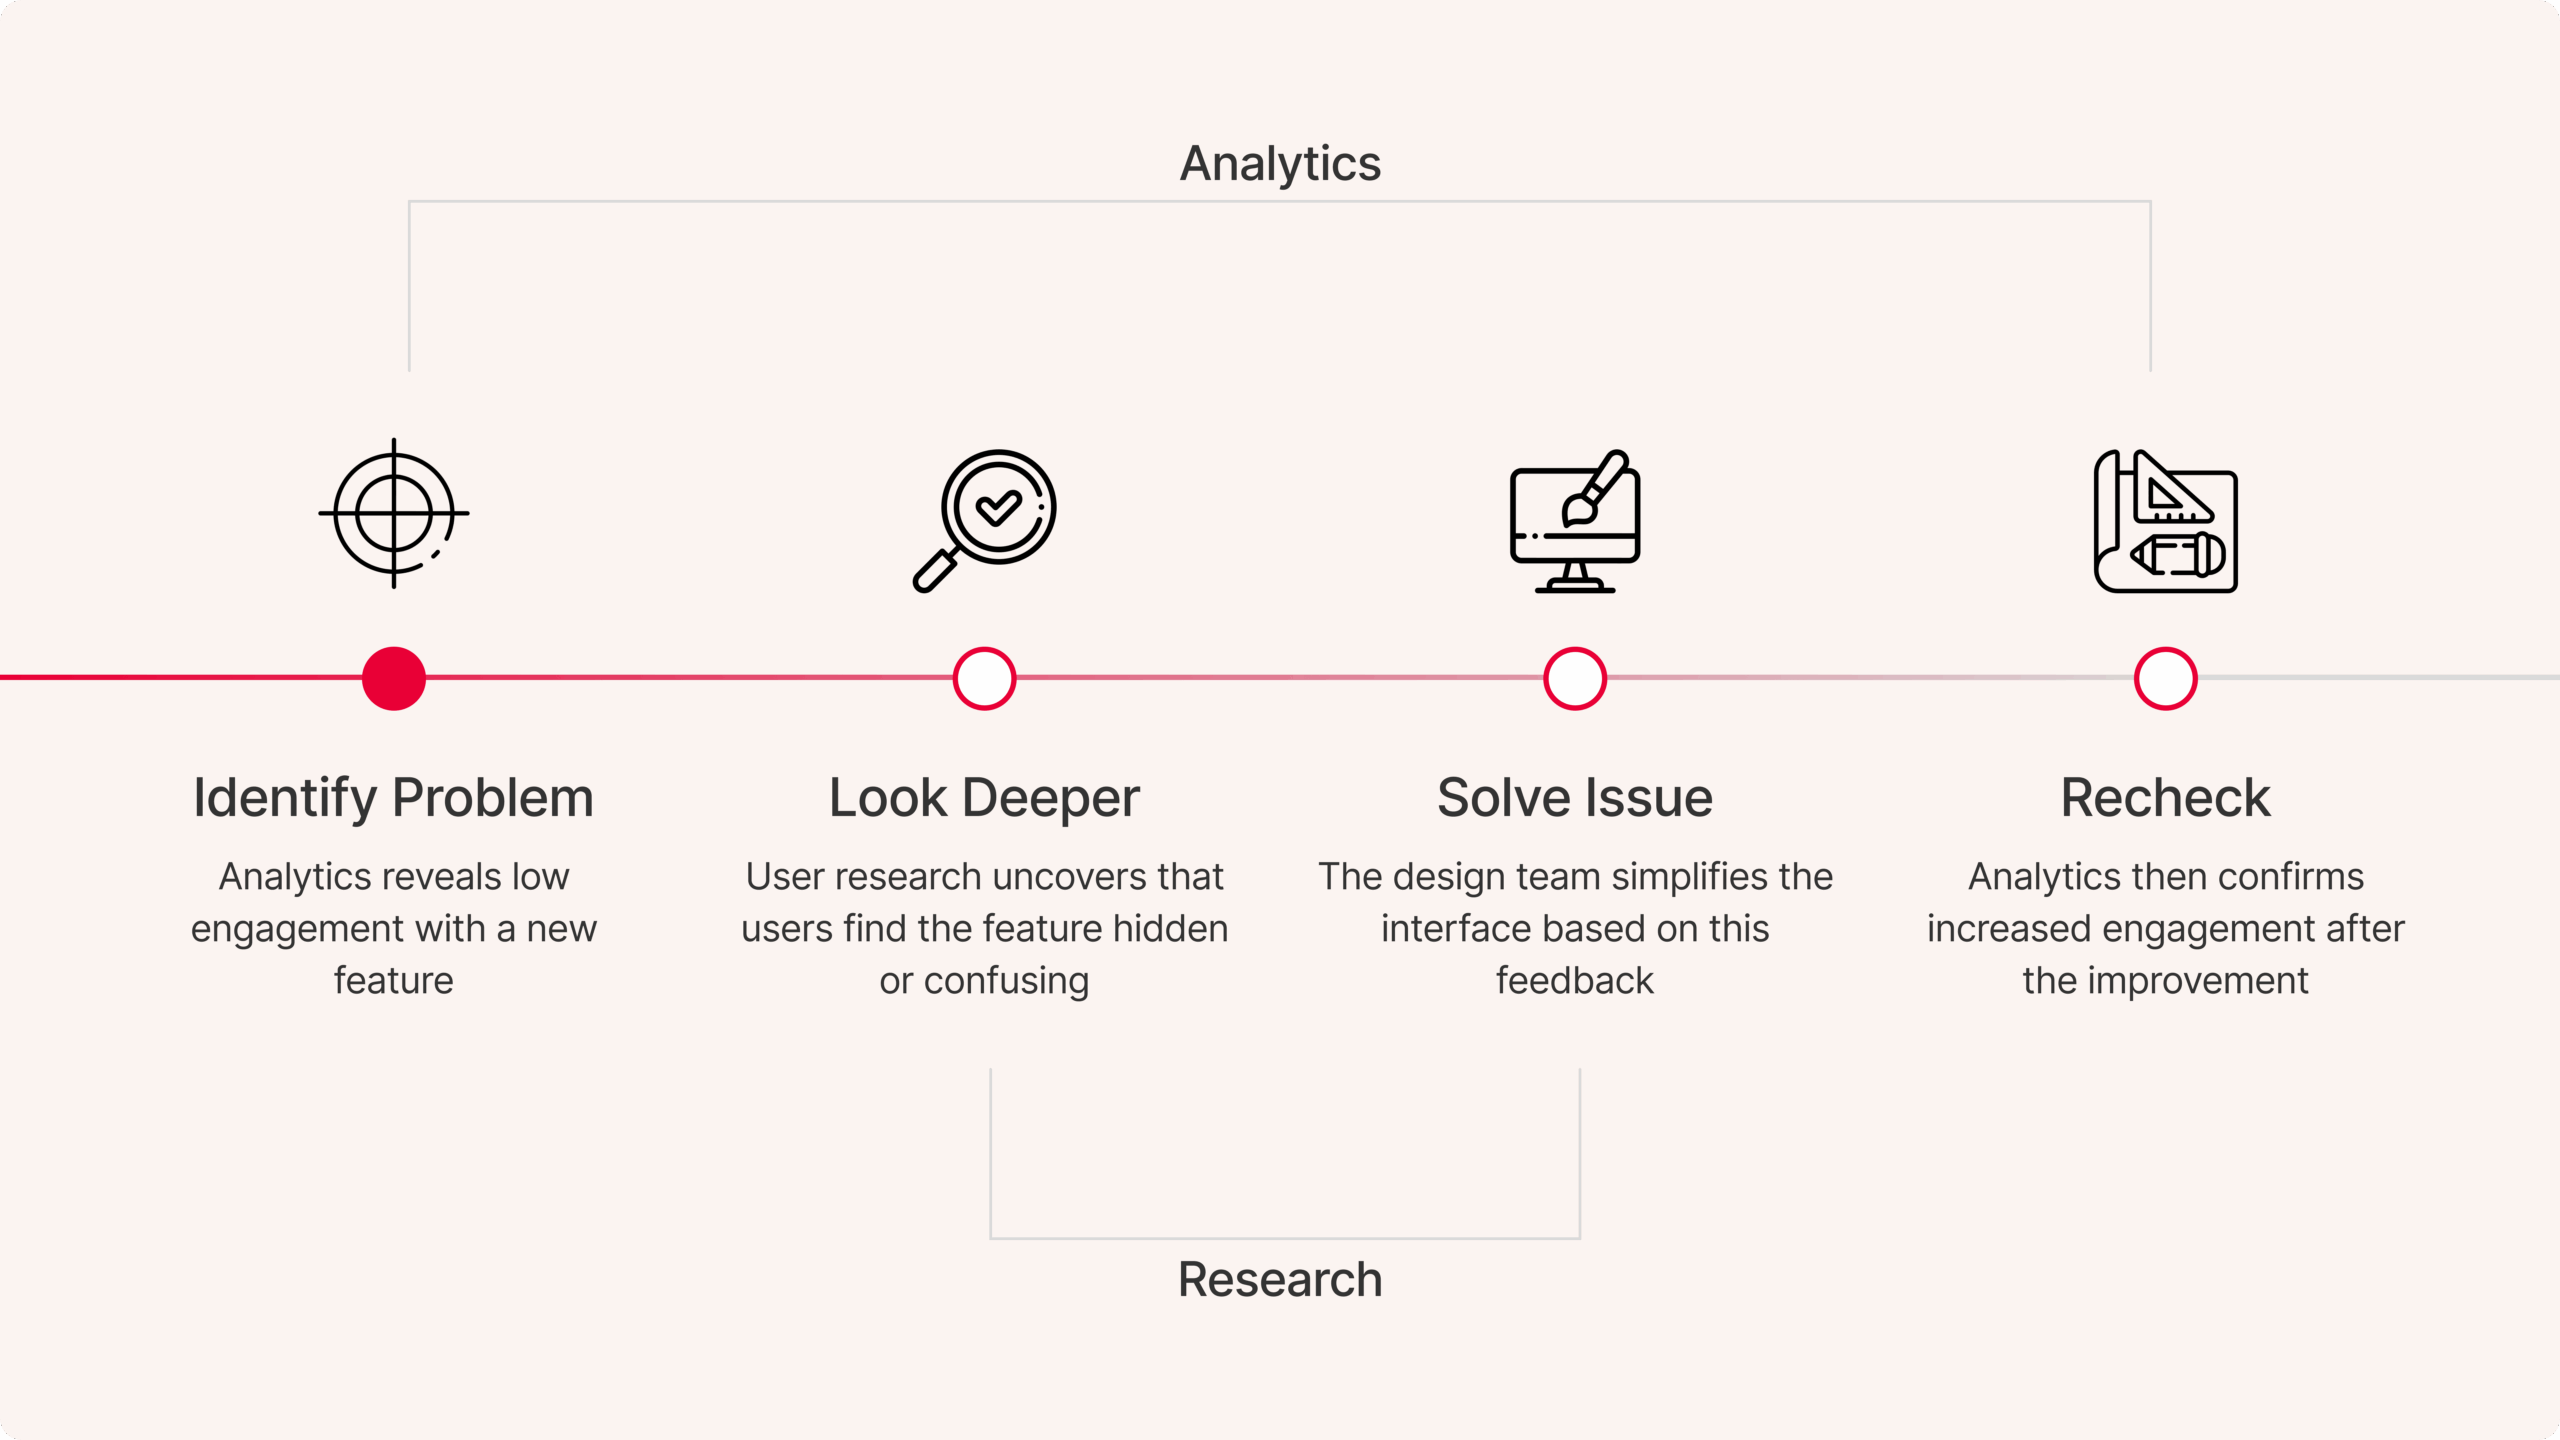
This approach ensures you’re making strategic, evidence-based decisions that genuinely improve user experiences. You’re not just chasing numbers; you’re actively solving real human problems.
Why This Matters
Users aren’t mere data points; they’re real people with specific needs and expectations. Analytics can optimise conversions, but user research builds empathy and authentic connections. Successful products and brands today understand that deeper user insights lead to stronger relationships and loyalty.
When you invest in understanding both “what” users do and “why” they do it, you demonstrate genuine care. Users sense this authenticity and respond positively, leading to higher retention and engagement.
Beyond immediate benefits, combining analytics with qualitative insights strengthens your entire approach to product design. It cultivates a team culture that values empathy as much as efficiency. Teams become more thoughtful, user-centric, and proactive about solving real-world problems rather than merely reacting to numbers.
Another often overlooked but equally important part of this equation is how you communicate insights back to your team or stakeholders. Insights have to be shared in a way that makes people stop, pay attention and understand. This is where data visualisation and storytelling come in. Turning numbers into clear visuals and weaving a narrative around them makes complex findings digestible.
A messy spreadsheet may hold all the answers, but unless it’s distilled into something people can see and feel, the insight can get lost. Data becomes powerful only when it’s presented in a way that others can act upon.
It’s worth asking yourself: how can I help others see what I now know? Simple, elegant dashboards, visual highlights of trends, or a few strong slides that combine user quotes with numbers can often move a room more than a 30-page document. The way you tell the story is what ensures that all this hard work of collecting and connecting dots leads to real, meaningful action.
This deeper understanding not only improves user satisfaction and engagement but also positions your brand uniquely in a competitive marketplace. People gravitate toward brands that understand and respond to their needs on a deeper, human level. Over time, this trust builds lasting customer relationships, driving sustained growth and long-term success.
Data gives clarity and evidence to support informed decisions. User research offers the empathy and deeper context necessary to ensure these decisions truly resonate with users. Both are essential for anyone who wants to create impactful, meaningful experiences.
So, the next time your analytics indicate an issue or opportunity, don’t rely solely on assumptions. Talk directly to your users. Combine data with genuine human insights, and you’ll build products and experiences that truly matter.
If you’re ready to leverage the combined power of analytics and user research to build meaningful user experiences, get in touch with us at Friday Agency. Let’s start a conversation about how we can help you truly understand your users and create impactful solutions together.


