Ux in Ireland Report
The State of the Nation 2024


We've compiled insights from over 100 business leaders and practitioners in Ireland, reflecting perspectives that showcase the degree of User Experience Design (UX) maturity within the industries and sectors where UX design plays a role.
UX maturity measures the sophistication in approaching user experience, design, and research. UX impacts brand perception, customer conversion, retention, and overall success. It yields substantial advantages, boosts sales, and reduces operational costs.
We hope to repeat the research every year in order to generate comparative data.
 Dave JacksonFounder and UX Director
 Shane BrennanSr. UX Researcher and Designer
 Karen O’SullivanUX Researcher and Designer
The Highlights
As we delve into the intricacies of UX maturity, 4 pivotal aspects emerge.
These aspects shed light on the state of design maturity, across the current business landscape in Ireland.
Mid-High Level of Design Maturity Overall

Accessibility is a Priority

Lower UX Maturity in Leadership

Varied Budget Estimations

The NN/g Model
The Nielson Norman Group's UX-maturity model provides a framework to measure an organisation's desire and ability to successfully deliver user-centred design across 6 maturity levels.
We've used this framework to measure the average level of UX maturity in each industry and job role. Participants self-evaluated their own approach to UX practices, and that of the company they work for.
Stages of UX Maturity
- 1
Absent
- Ignored
- Non-existent
- Undiscovered
- 2
Limited
- Uneven
- Haphazard
- Aspirationa
- 3
Emergent
- Functional and promising
- Inconsistent
- Inefficient
- 4
Structured
- Partly systematic
- Variably effective
- 5
Integrated
- Comprehensive
- Pervasive
- Universal
- 6
User-driven
- Beloved
- Reproducible
- Habitual
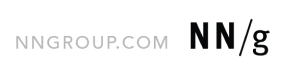
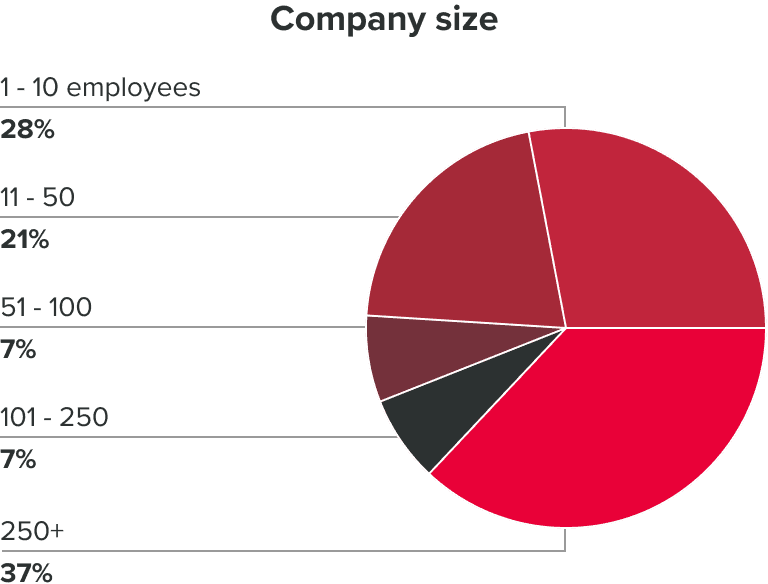
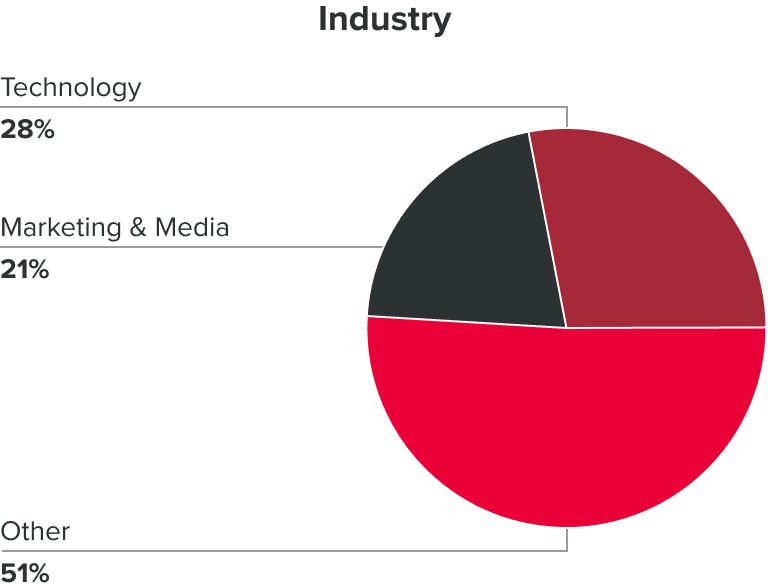
Demographics
The survey ran from Oct 3rd - 11th 2023, with 107 responses and 9 from direct UX roles being removed.
Targeting
We specifically targeted participants with the following criteria:
- Senior level role or higher.
- Based in Ireland.
- Industries with potential exposure to UX practices, such as Technology, Marketing, Media, Consumer Goods etc.
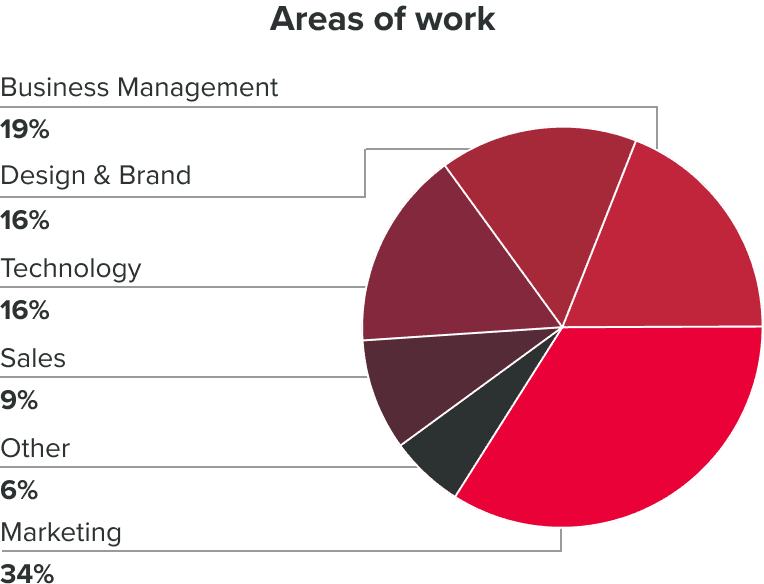
- Roles that could have cause to engage directly or indirectly in UX practices, such as Marketing, Design & Brand, Technology, Business Management and Sales.
*Specifically excluded were those working directly in UX, UI or Product roles to avoid skewed or biased results. We are interested in the perception of UX from the outside.
The Results
Understanding of UX
Segmented by Department
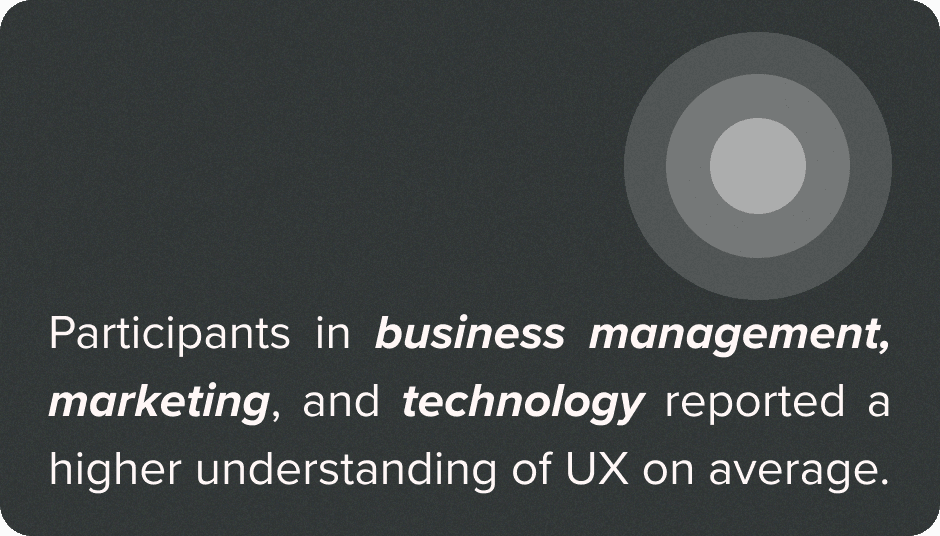
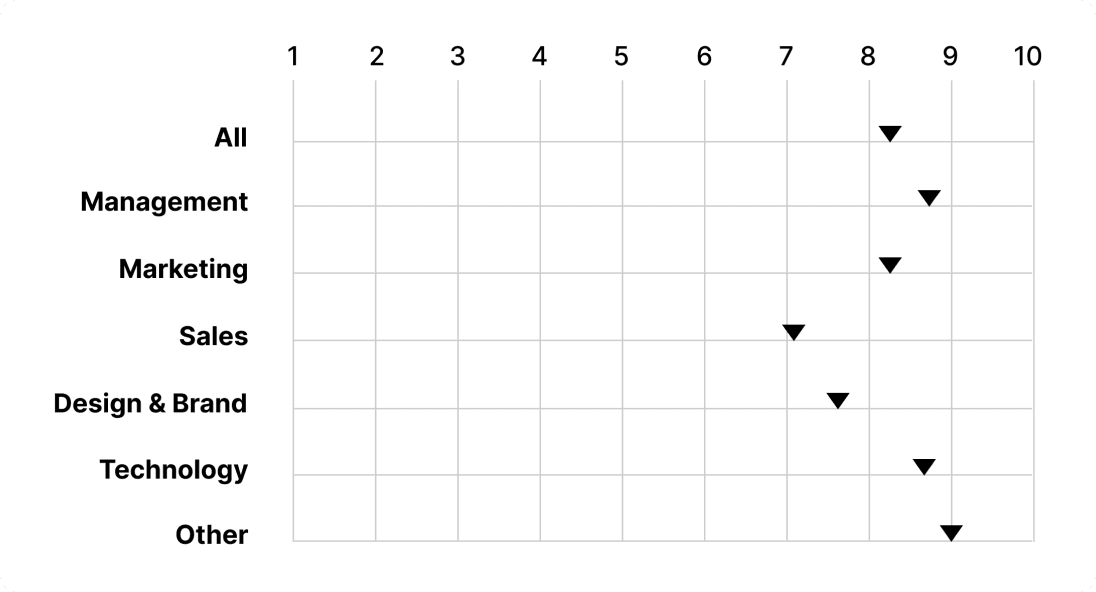
Participants in business management, marketing, and technology, on average, reported a higher understanding of UX, with those in technology boasting the highest self-reported design maturity level, at the “structured-integrated” level.
Conversely, those working in Sales and Design & Brand reported the least understanding of UX practices.
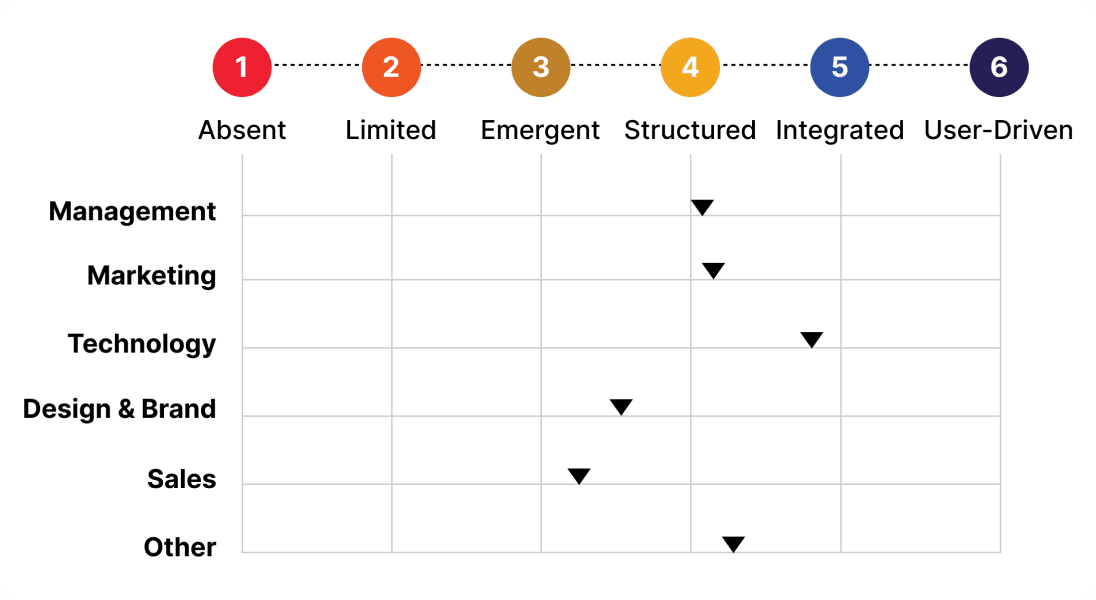
Participants' understanding of UX, segmented by department
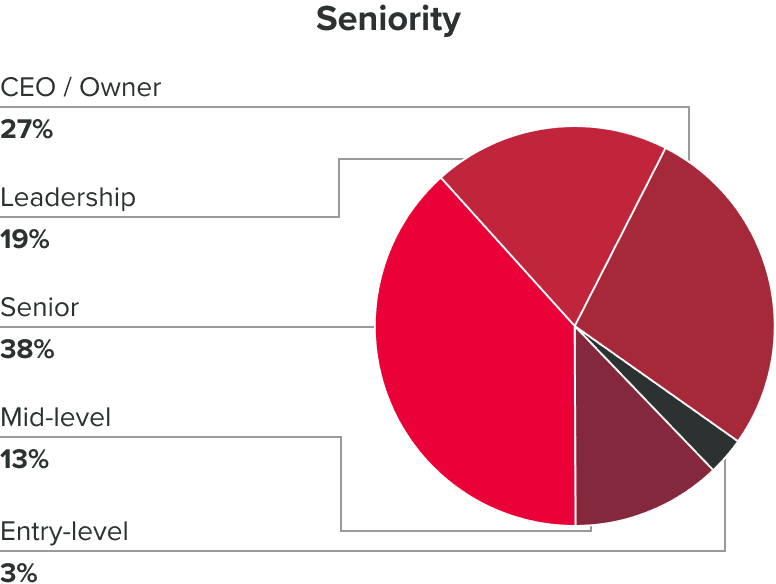
Segmented by Seniority Level
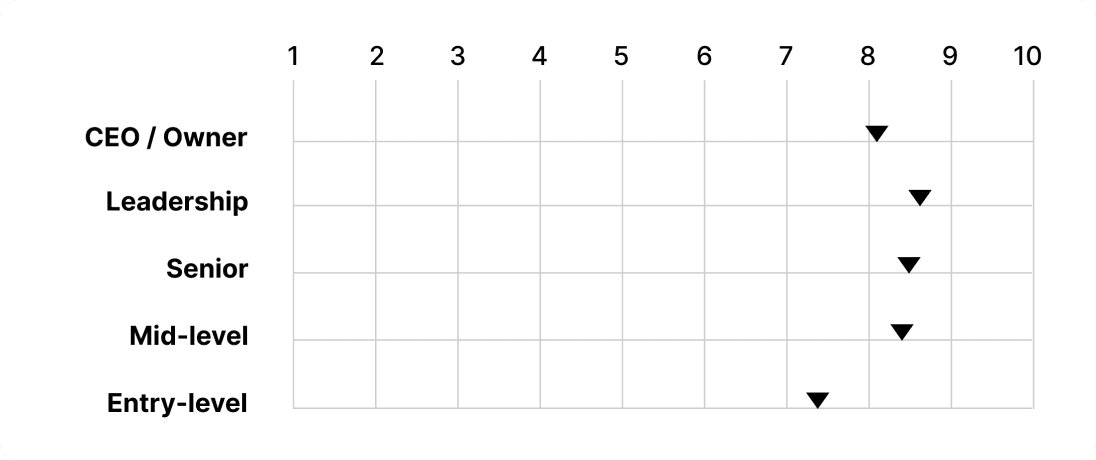
The reported understanding of UX for CEOs or business owners was notably lower compared to most other levels of seniority within organisations. We found that leaders are reporting a UX maturity level similar to that of entry-level employees.
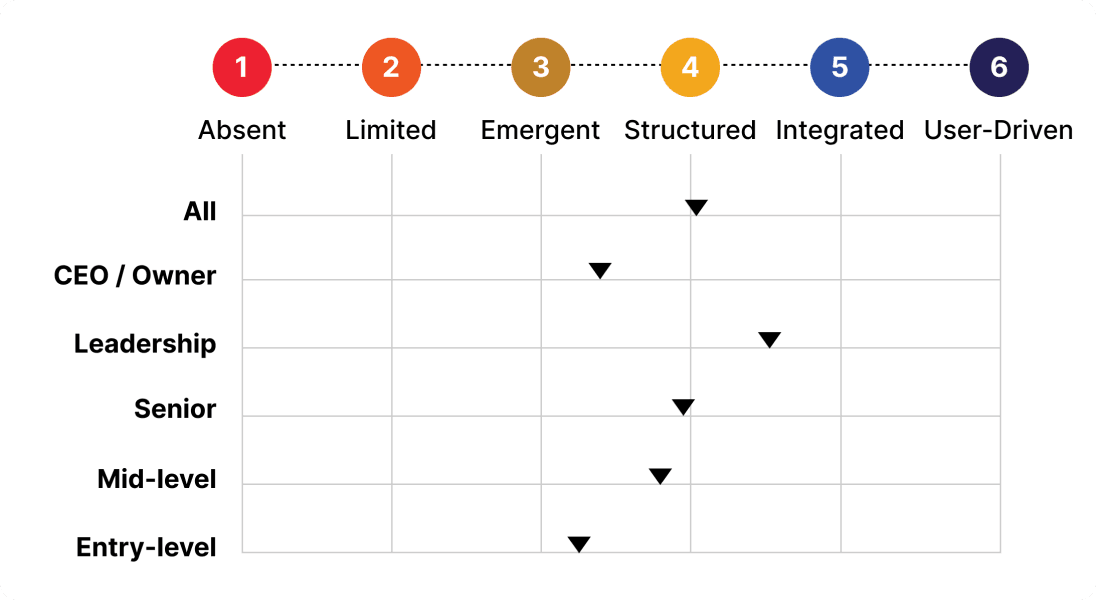
Participants’ understanding of UX, segmented by seniority
Exposure to UX
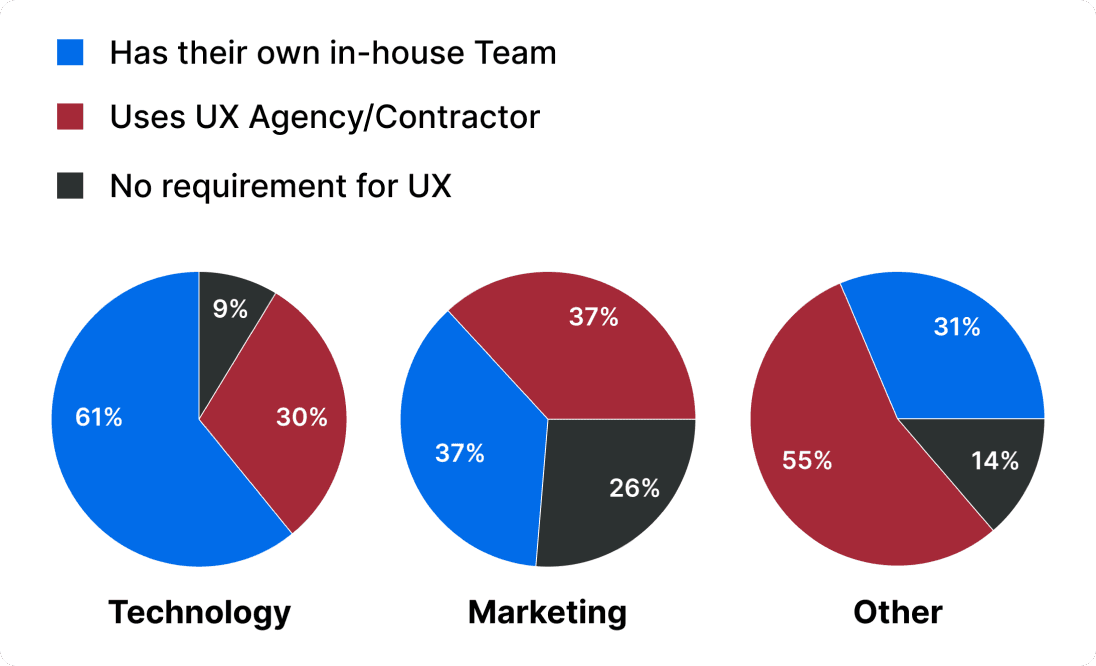
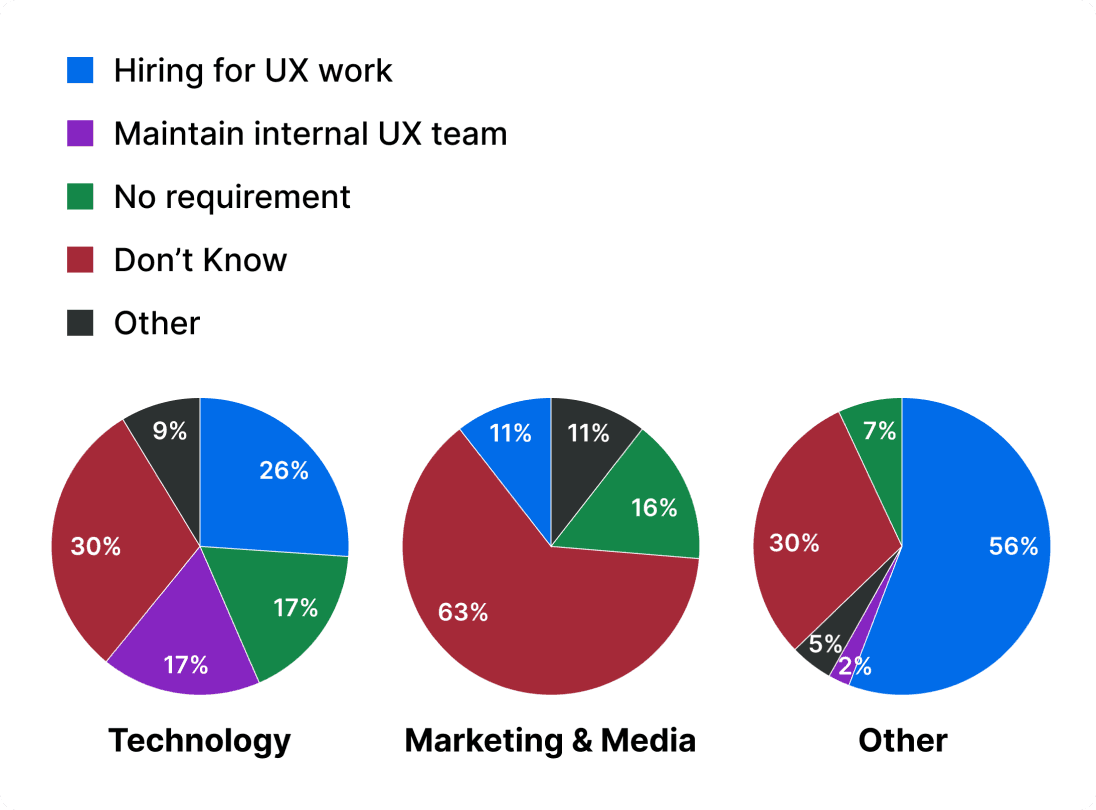
Company exposure to UX, segmented by industry
Technology
Participants in technology reported the highest exposure to UX practices within their organisation with 61% maintaining an in-house UX design team and 30% outsourcing UX work to agencies and contractors. Nevertheless, the 9% indicating no past requirements for UX design or research highlights potential room for improvement in recognition of the role and benefits of UX in technology organisations.
Marketing & Media
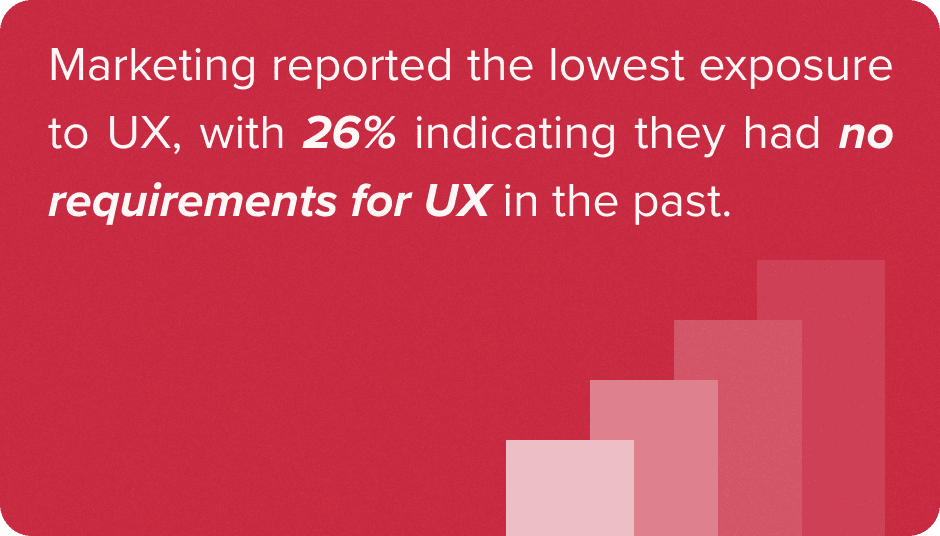
Participants in Marketing & Media reported their organisations as having the lowest exposure to UX of those surveyed, with 26% indicating that there had been no requirements for UX design or research in the past. This suggests a lack of awareness of the beneficial relationship between marketing and media and UX practices.
Other Sectors
From the mix of other organisations that we surveyed, participants reported relatively high exposure to UX within their organisation, with the majority having outsourced UX design and research work to agencies or contractors.
Approach to UX
Technology
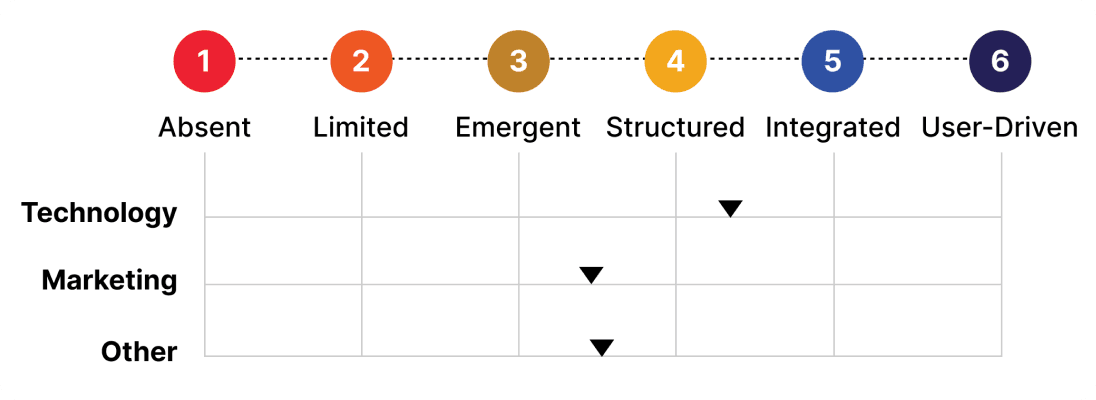
It's not surprising that those working directly in technology reported the highest level of design maturity, this was reported to be between structured and integrated. Nobody working in the technology sector reported that UX was ignored or nonexistent.
Marketing & Media
Our data from the marketing sector tells us that UX is regarded as being functional, is becoming more widespread but still lacks structure. However, 15% within this sector also reported that UX was ignored or nonexistent.
Other Sectors
The mix of other sectors we surveyed reported marginally higher levels of design maturity than the marketing sector. They were similarly at the level between emergent and structured and with only 5% reporting that UX was ignored or nonexistent.
Value of UX
Perceived value of UX in business, segmented by department
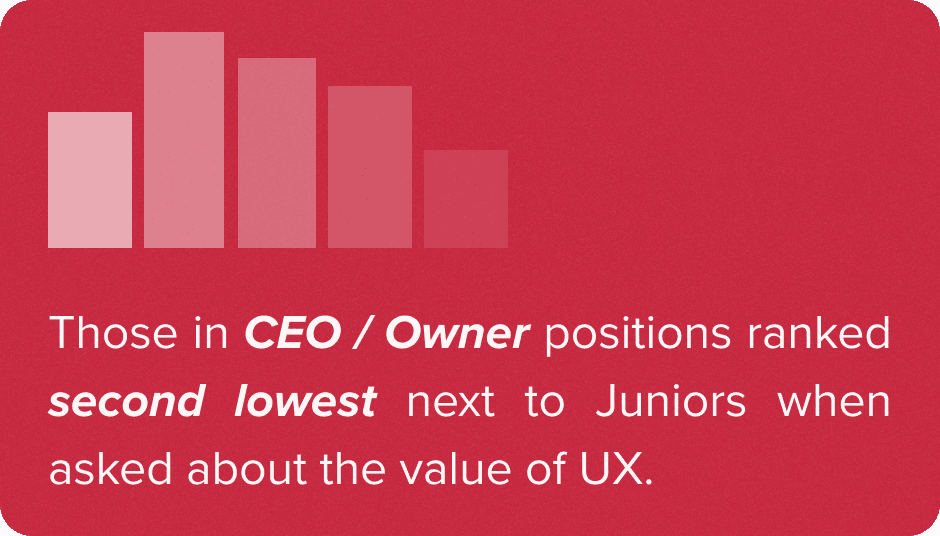
When segmenting by seniority, entry-level participants ranked UX value the lowest, and then it trends upwards slightly as we climb seniority - until we reach the CEO/Owner level. Those in top level leadership actually ranked second lowest in perceived value.
While it is certainly the job of UX designers to advocate for the ROI of UX, it would seem that there is still some resistance or lack of awareness at the C-suite level.
Perceived value of UX in business, segmented by seniority
The Non-UX Designer Perspective:
On average, design respondents gave some of the lowest scores in perceived UX value. We see a similar pattern in designers' responses regarding general understanding of UX.
It could be considered counter-intuitive to find that designers consider themselves to have less appreciation of UX than other departments, being in an adjacent design role themselves. They do lie specifically outside the UX field themselves however, so could have little to no digital design exposure at all.
They had unique outlier scores in the 2 - 3 out of 10 range when asked about the value of UX, which certainly affects their average, and possibly indicates some stronger feelings when compared to other roles surveyed.
Requirements for the next 12 months
38% of all participants didn't know whether the organisation they work for will be hiring for UX work, this number increased to 71% for those who work in marketing and media organisations.
Those working in marketing and media also reported a very low level of UX design and research requirements for 2024, with 16% reporting no requirement and only 22% indicating a definite intention to either hire or outsource UX work.
Company UX requirements for the next 12 months, segmented by industry
What department would UX fit under?
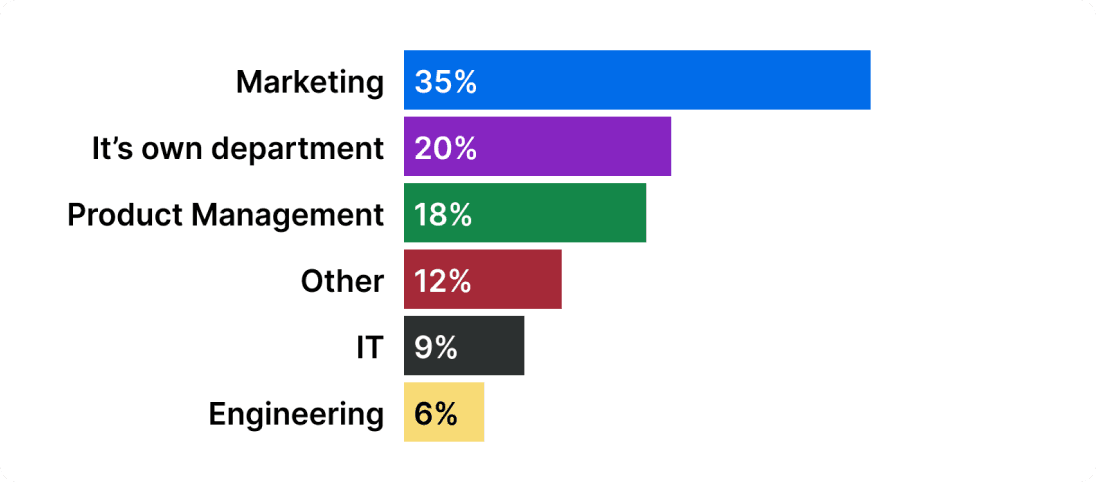
Departments in which participants would place a new UX hire
Design & Brand were most in favour of having a dedicated department, but also had the most answers that didn't fit into the named categories provided. More than any other department, they chose the 'Other' option and described how there was perhaps more nuance to the issue than the options allowed.
UX Projects
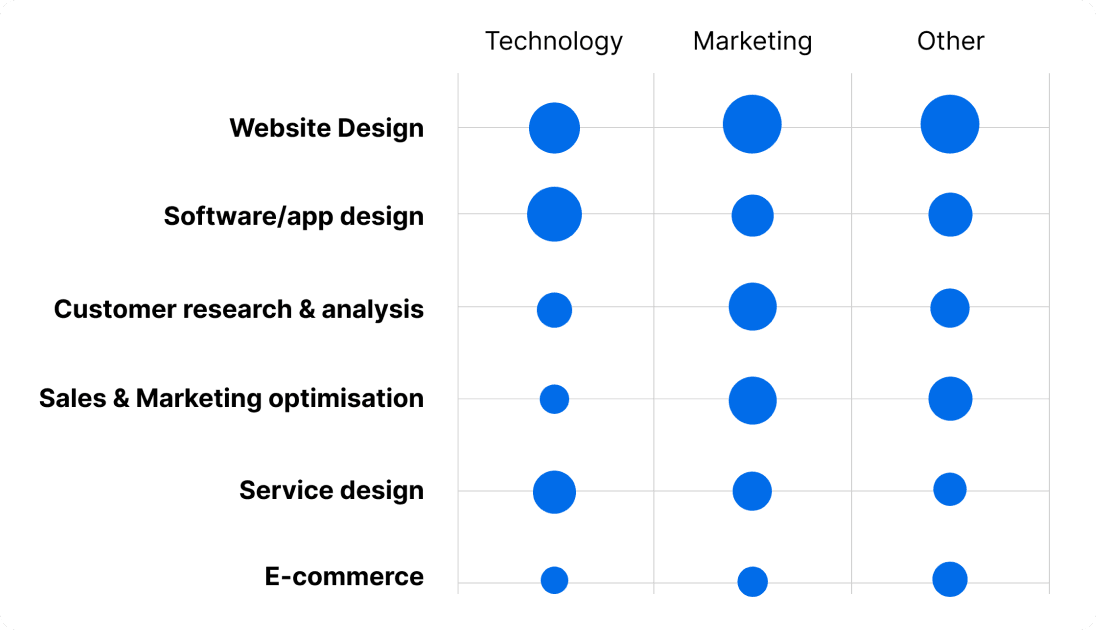
Projects that could benefit from UX practices
Accessibility
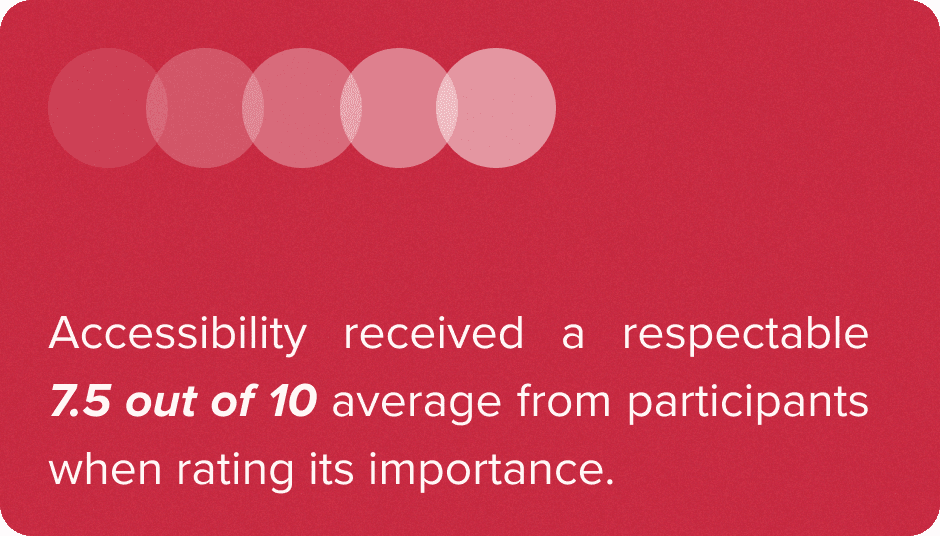
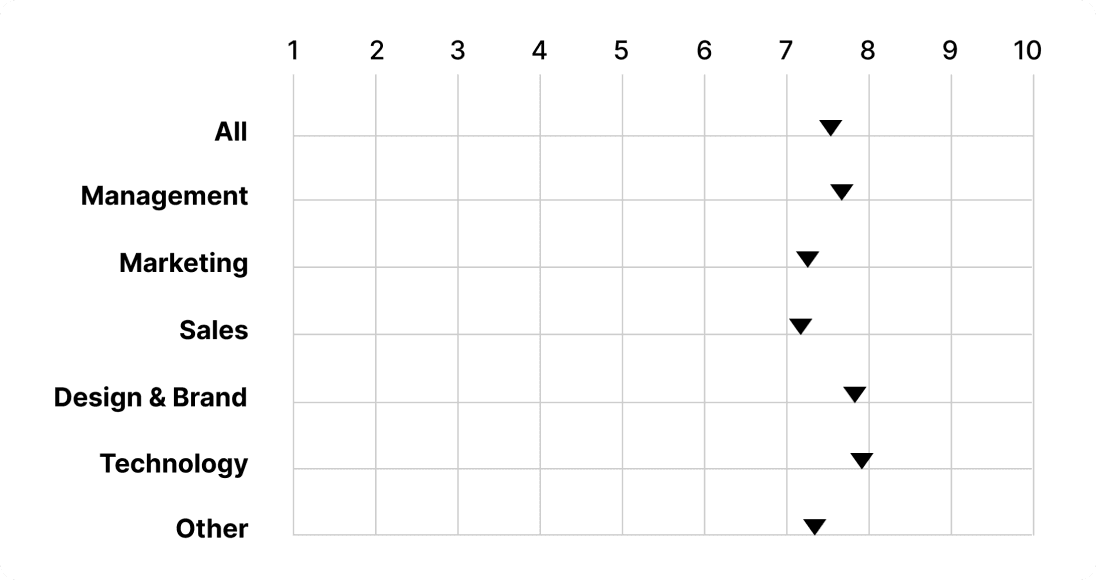
Perceived importance of accessibility in business, segmented by department
We see participants ranking its importance within their business averaging 7.5 out of 10, and when segmenting by department we see that there is hardly any deviation from the average at all. Technology and Design led the pack, with Business Management close behind.
Not surprisingly there are a few negative outliers. 5% did rate the importance of Accessibility in their company at a 1 out of 10, indicating that there is still a small portion of the market completely ignoring the need to accommodate users outside the abled majority.
Budget
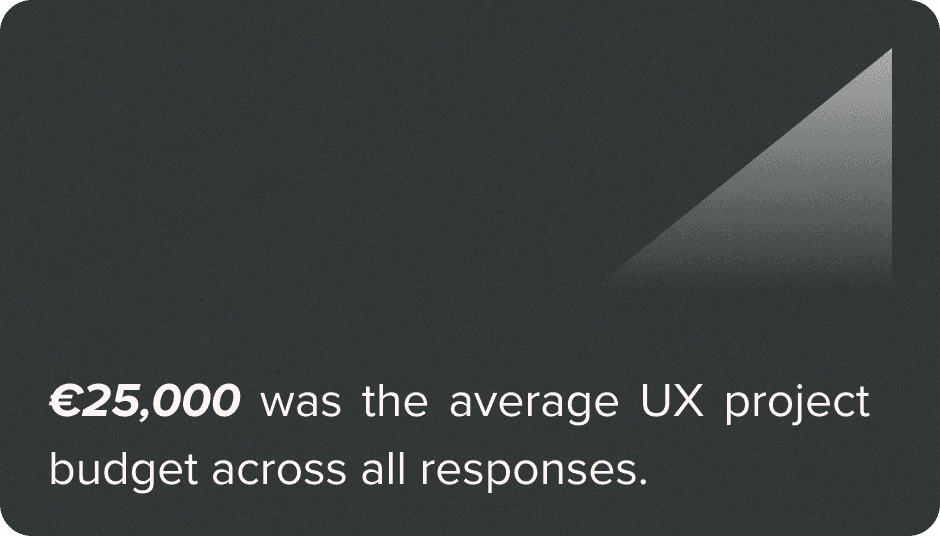
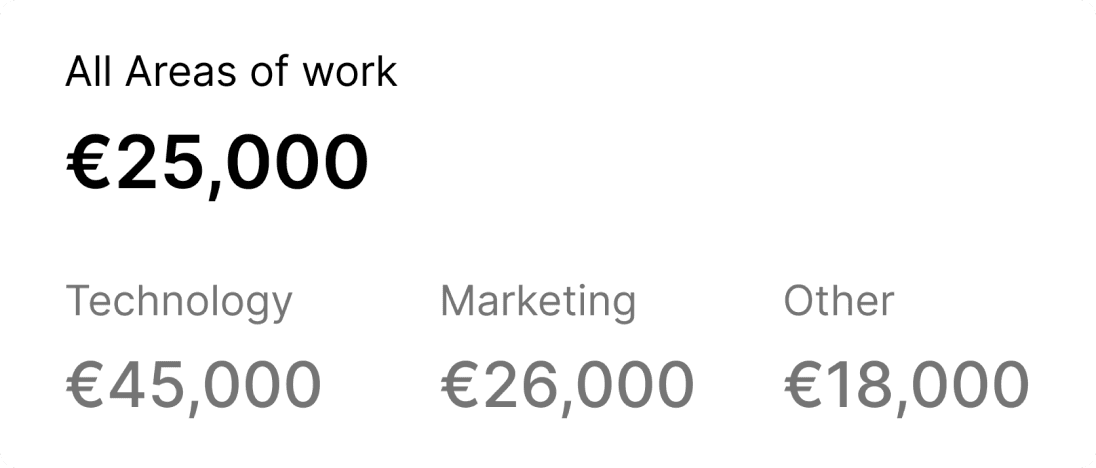
Expected budget for a UX project
Overall, 24% of participants did not know what budget a typical UX project required, this number rose to 43% for those who do not work in technology or marketing.
Our Thoughts
Expectations
We were not surprised by the level of UX maturity within the technology sector, but the reported levels of UX maturity outside of technology were significantly higher than we had anticipated.
This data is positive and promising, however, having comparative data after repeating the research next year will provide a good benchmark and some perspective.
Possible Over-Estimation
Participants self-reporting on their knowledge and experience may be influenced by challenges such as lack of objectivity, interpretation variations, and biases related to social desirability, potentially skewing the data. These considerations are important when interpreting and drawing conclusions from the survey results. *From https://www.nngroup.com/articles/state-ux-maturity-quiz/
A fully integrated UX process is a high bar to reach. 14% of respondents reported that they "adopt a fully user-driven strategy” on an individual basis. Similarly at the organisational level, 13% reported that “user-driven processes are applied at all levels,” and another 22% said that “UX work is comprehensive, universal and effective.“
NN/g found 0.04% of 5000 self-reported UX professionals around the world to be at Level 6 - fully user driven.* This could suggest a possible over-confidence in some participants, or perhaps a lack of knowledge in what truly constitutes a fully user-driven and rigorous UX practice.
*From https://www.nngroup.com/articles/state-ux-maturity-quiz/
Areas of Promise
It’s encouraging to see a strong emphasis on the importance of accessibility within organisations. The hope is that this sentiment translates into tangible actions and commitments in the adoption of universal design.
In late 2023 the Government of Ireland released a Roadmap for Embedding Design in the Public Service. This works towards "a proactive, human-centric, and collaborative approach to designing better public services,” while also outlining its own design maturity model. It's a very encouraging development for both public services and the design industry. Something that is sure to raise the bar of design thinking across the country.
Unlocking Potential
UX maturity can only be driven effectively if there is buy-in from the top. While CEOs/business owners reported a relatively low level of UX maturity, others in leadership roles displayed some of the highest levels. This is positive, as these are the people best placed to be UX evangelists.
Encouraging the adoption of UX practices within an organisation involves a combination of education, advocacy, and practical implementation. Stakeholders need to be clear on the benefits to the business, this can be done by demonstrating the return on investment. Only when you have buy-in can you start integrating UX into processes and start creating a true UX culture.
References & Acknowledgments
We'd like to take this opportunity to thank all of our research participants and contributors to this study and to the NN/g Group for providing the UX Maturity Model.
Research, analysis, reporting and design were created in collaboration between Dave Jackson, Shane Brennan and Karen O'Sullivan from Friday Agency. We hope that our findings will help people and organisations take stock and look at how they approach UX going forward.
